![]() Os referí en el artículo S-025 que había probado la solución de ApexGrid, que podría ser la solución de DataGrid para cualquier proyecto, pero que había desistido de utilizarla porque no vi cómo se podía adaptar al español.
Os referí en el artículo S-025 que había probado la solución de ApexGrid, que podría ser la solución de DataGrid para cualquier proyecto, pero que había desistido de utilizarla porque no vi cómo se podía adaptar al español.
Al cabo de pocos días, consulté otra vez la web de ApexGrid e identifiqué que se había publicado la versión 3.3.0 y que se había solucionado este problema y además, se había renovado la web de documentación, estando mucho mejor.
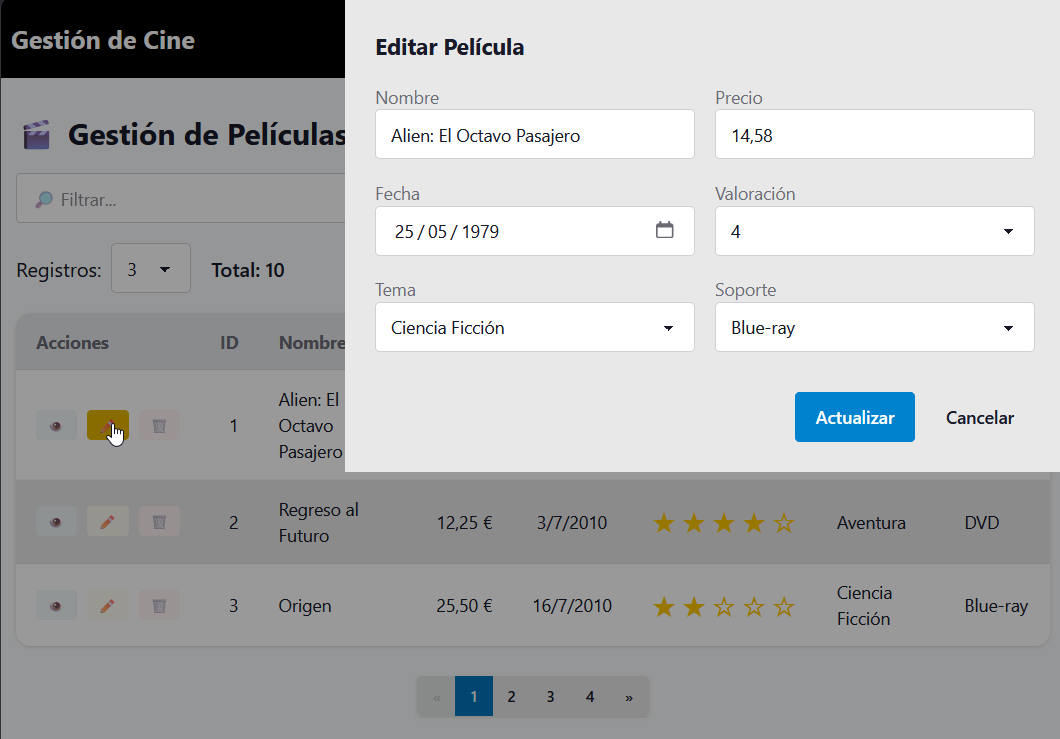
Completé la demo que estaba haciendo y mi impresión es que todavía hay muchos aspectos que no entiendo de la solución, por ejemplo, que las acciones a nivel de registro, el típico CRUD, no esté disponible en la versión Community y su en la Profesional, por ello, en mis proyectos voy a seguir utilizando el DataGrid que he explicado en el artículo S-025 . Este artículo lo publico porque es posible que pueda ayudar a quién se inicia en el uso de ApexGrid en Svelte, ya que la documentación, no explica nada de este entorno.
Objetivo
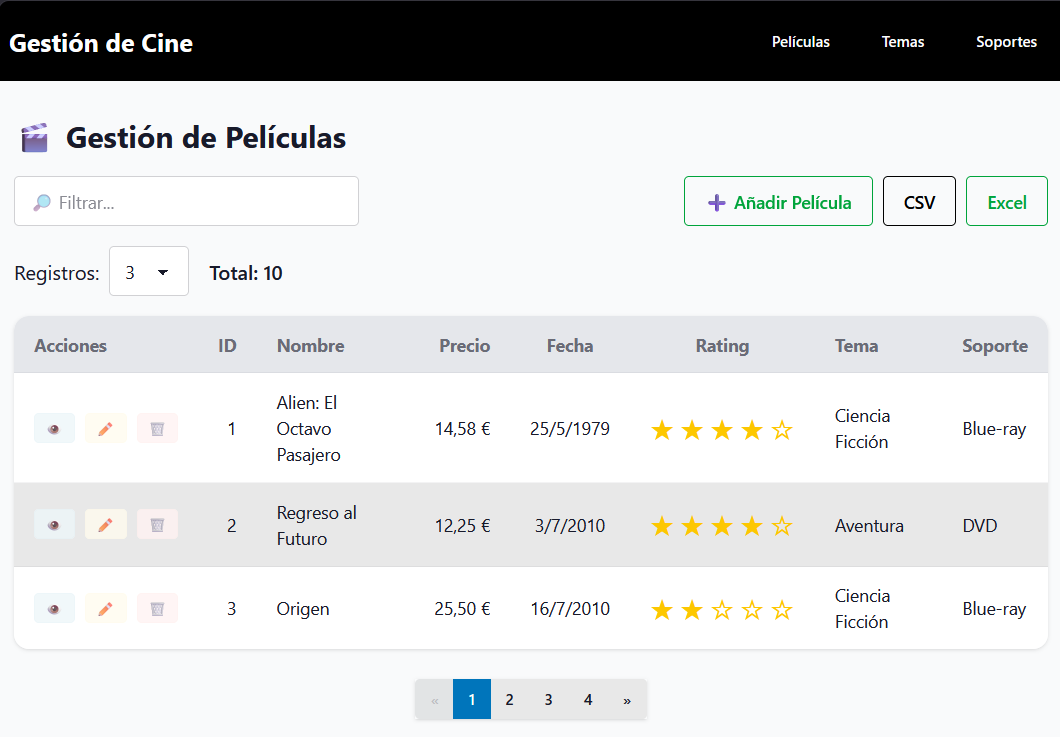
Seleccionar un DataGrid «potente» para integrarlo en las app’s de los desarrollos en Svelte.
DEMO: https://fhumanes.com/apexgrid-svelte/
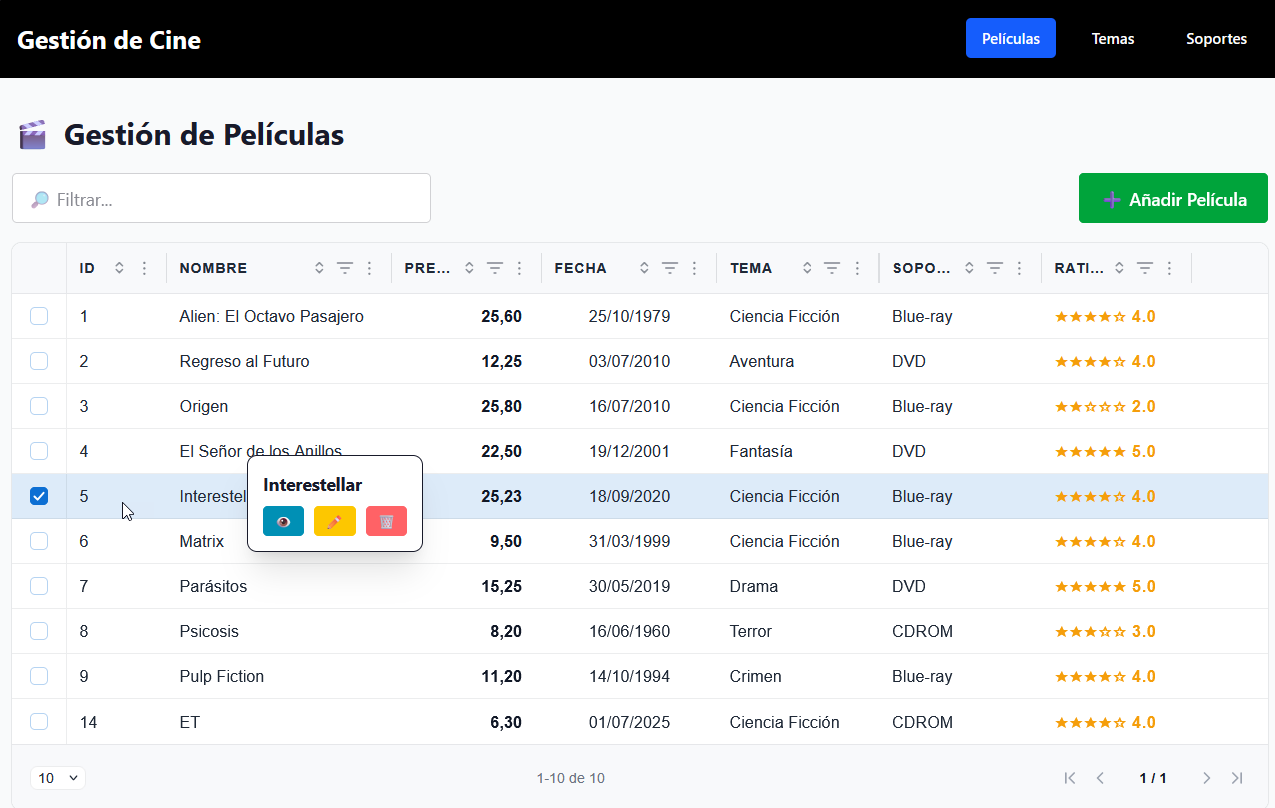
Para que salga el «popup» de las acciones hay que seleccionar el checkbox (casilla de verificación) o pulsar la tecla de «espacio».
Si estás interesado en este tema, sigue leyendo el artículo en este enlace.
 Una de las cosas que se repiten muchísimas veces es disponer de un «DataGrid», para mostrar y navegar por los elementos de una tabla.
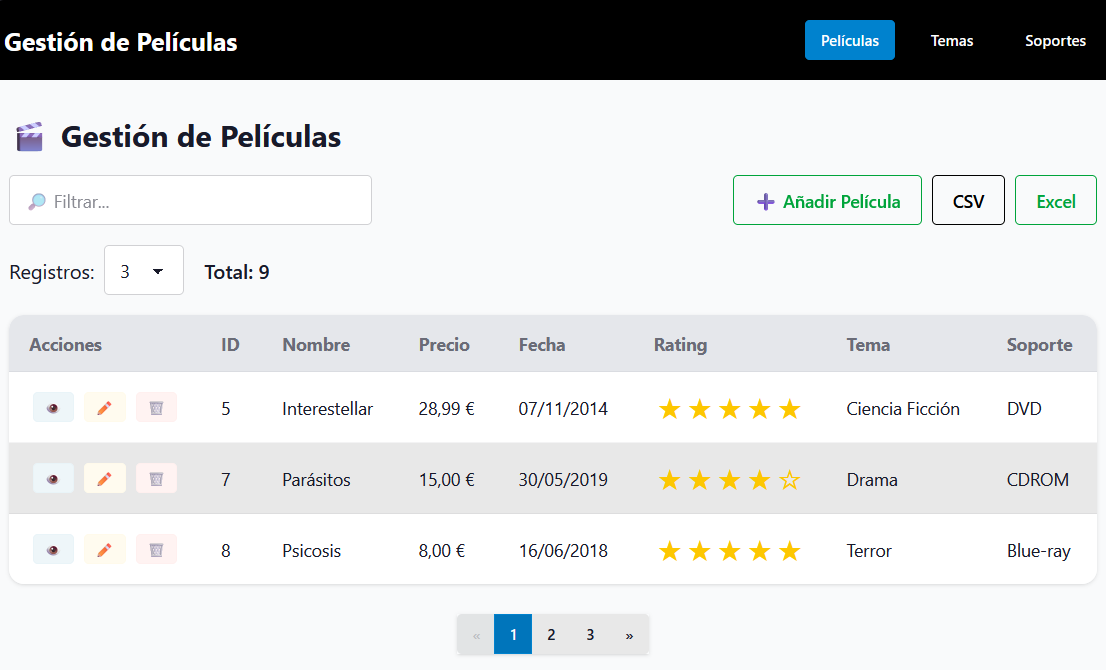
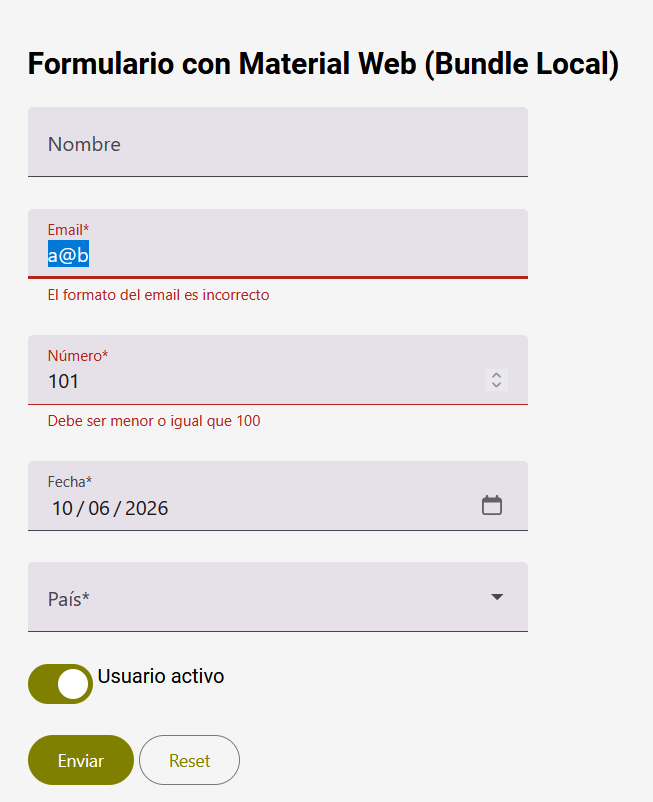
 🌐 Qué es Material Web