Veces vista: 23
 🌐 Qué es Material Web
Material Web es la implementación oficial de Material Design en forma de Web Components. A diferencia de versiones anteriores (Material para Angular, Material UI para React, etc.), esta librería está construida directamente sobre estándares del navegador, sin depender de ningún framework.
Esto significa que sus componentes:
- funcionan en cualquier proyecto HTML
- se integran en React, Svelte, Vue, Angular o Vanilla JS
- no requieren compilación especial
- son totalmente reutilizables y encapsulados
🧩 Por qué es importante para los frameworks modernos
✔️ 1. Un único código funciona en todos los frameworks
- Material para Angular
- Material Components for Web (MDC)
- Material UI (React) mantenido por la comunidad
- Variantes no oficiales para Vue, Svelte, etc.
Un único componente funciona en todos los frameworks.
✔️ 2. Los frameworks modernos ya están optimizados para Web Components
React, Vue, Angular y Svelte han ido añadiendo soporte nativo para Custom Elements. Hoy, Material Web se integra sin hacks ni adaptadores en:
- Svelte 5 (mi caso)
- React 18+
- Vue 3
- Angular 17+
✔️ 3. Es la forma más estable de usar Material Design
Material Web es la implementación oficial de Material Design.
🏢 Quién mantiene y evoluciona Material Web
Material Web está desarrollado y mantenido por el equipo oficial de Material Design de Google
Esto implica:
- soporte continuo
- actualizaciones alineadas con Material Design
- accesibilidad certificada
- rendimiento optimizado
- documentación oficial y ejemplos reales
Además, el repositorio es público y activo:
- Google revisa PRs
- Google publica releases
- Google marca la hoja de ruta
Esto lo diferencia de otras librerías UI que dependen de comunidades externas.
🚀 Por qué es relevante esta solución
Material Web es hoy:
- la implementación más moderna de Material Design
- la más compatible con cualquier stack
- la más fácil de integrar en proyectos PHP, ASP, JAVA, Vanilla, etc.
- una buena forma de aprender Web Components reales
🌀Pero……
Como resumen particular, creo que esta implementación es muy buena y aunque no tenga asegurado su futuro, que me gustaría mucho, es lo que suele ocurrir con todos los temas de implementación de soluciones.
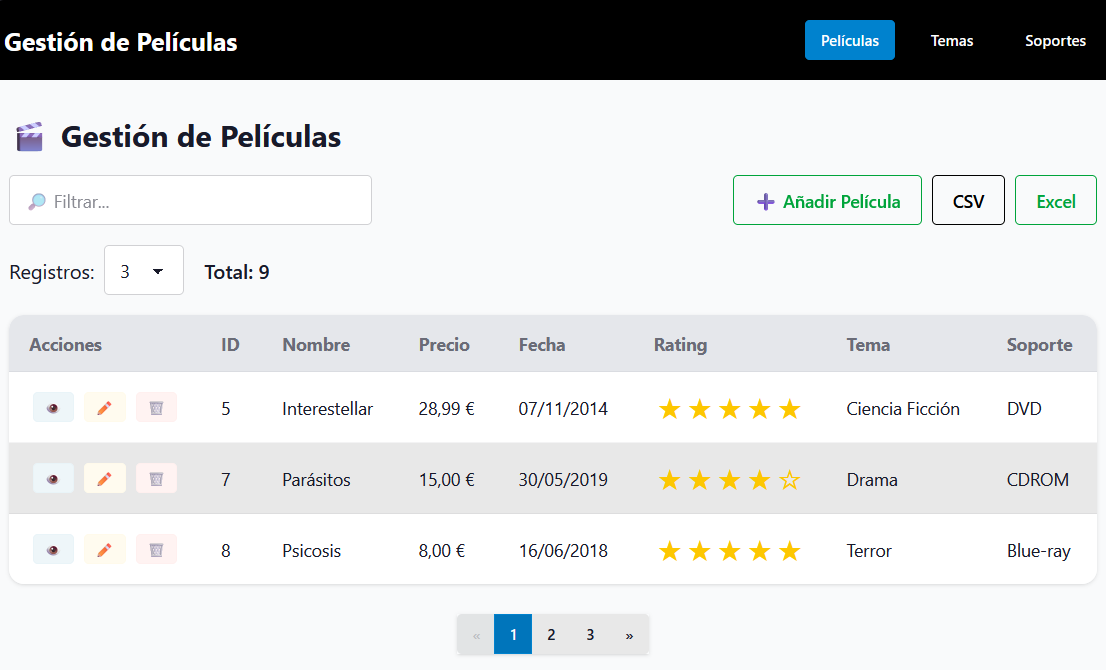
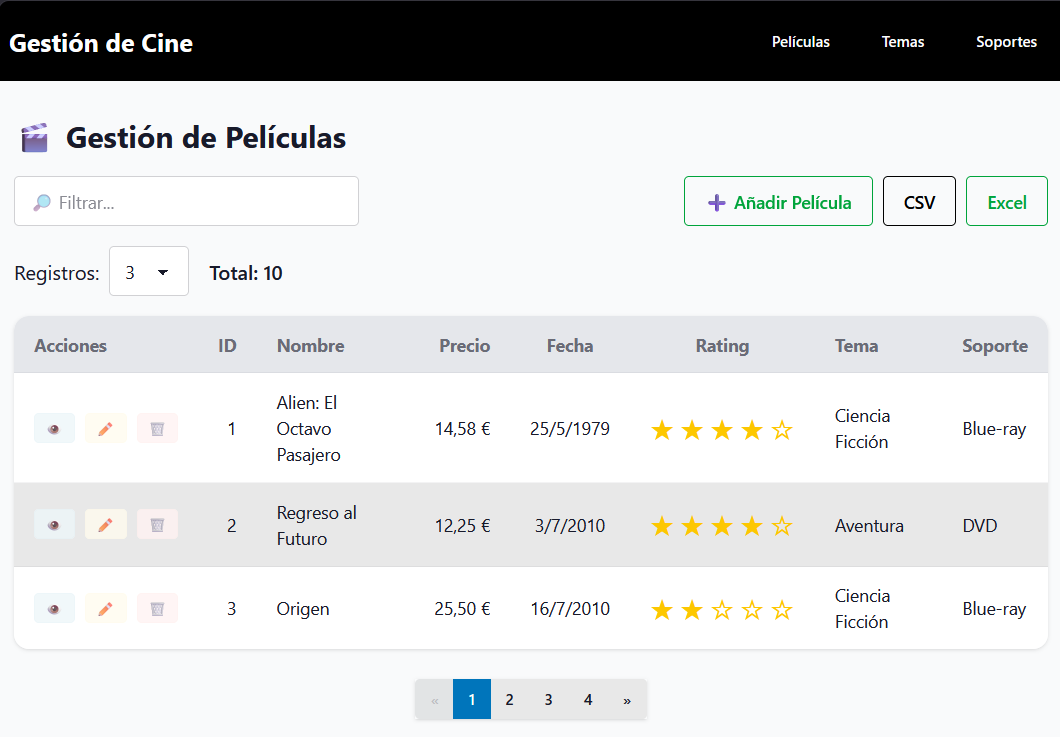
DEMO: https://fhumanes.com/wc-material/ y https://fhumanes.com/wc-material/index2.html
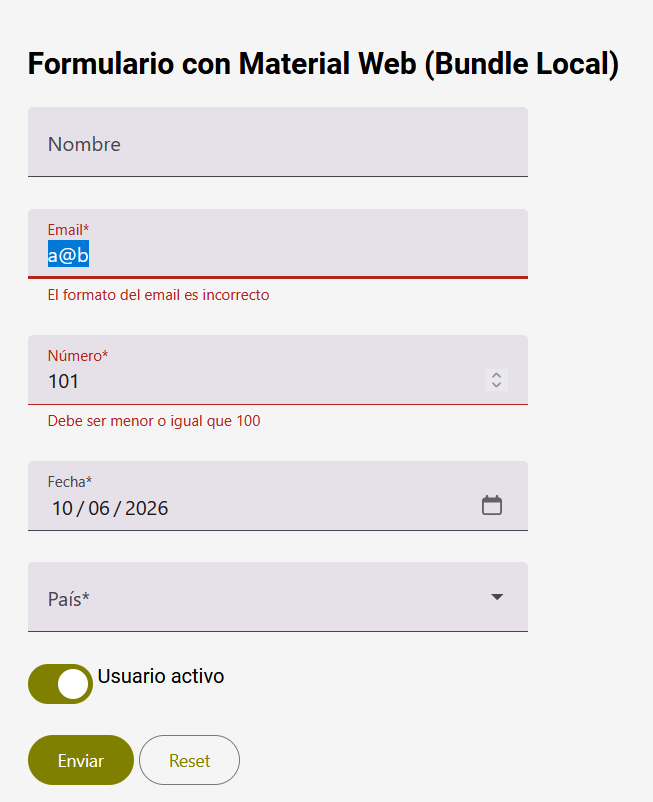
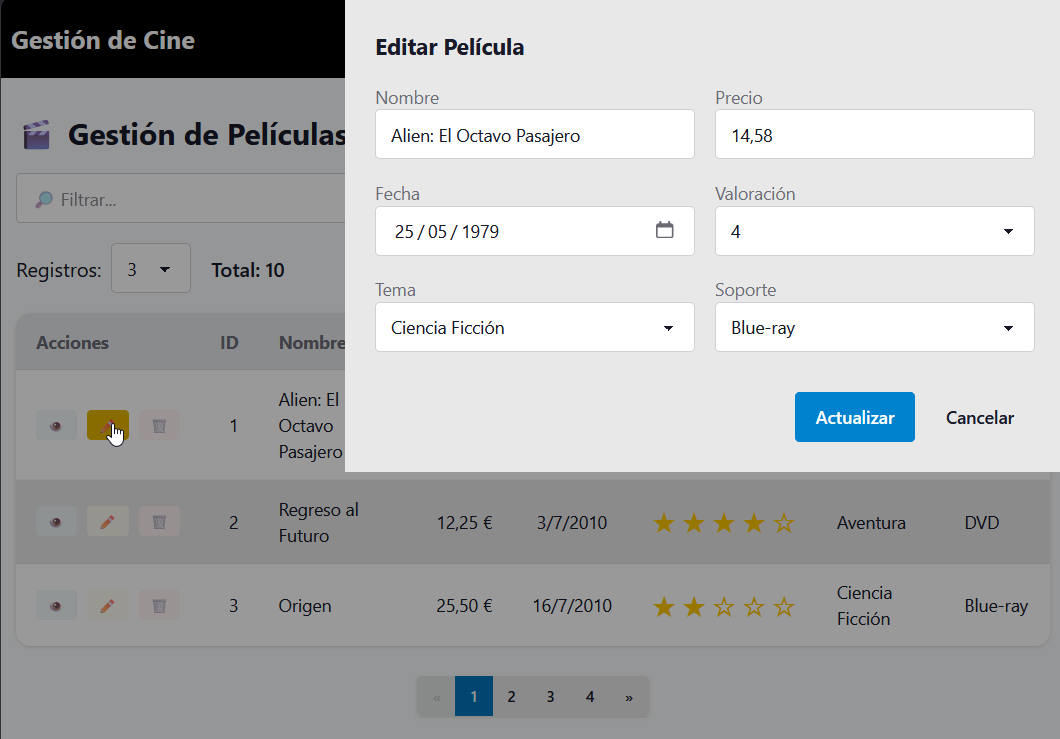
Es muy sencillo la personalización de los colores y del UI, siendo además muy fácil de definir los campos y sus validaciones
Si estas interesado en este tema, sigue leyendo el artículo en este enlace.


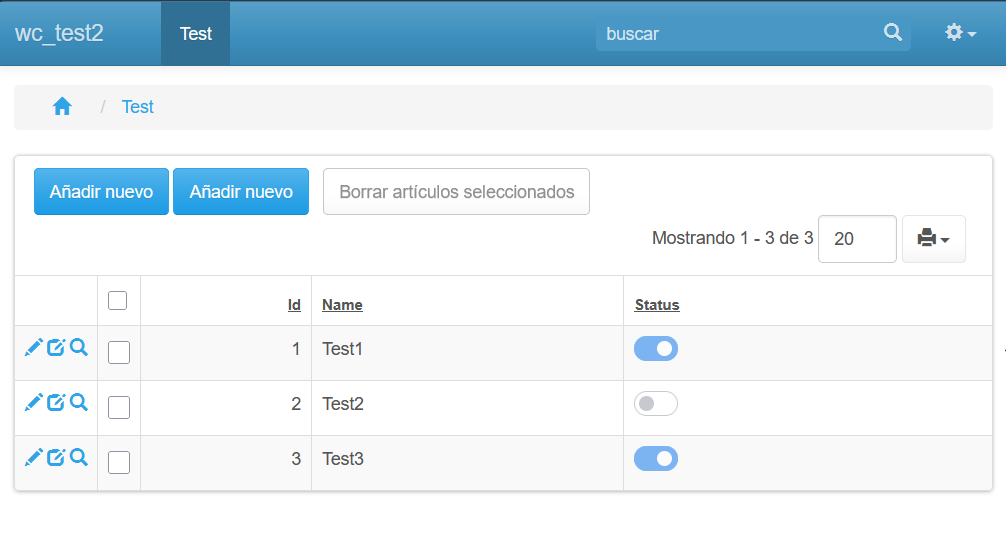
 Una de las cosas que se repiten muchísimas veces es disponer de un «DataGrid», para mostrar y navegar por los elementos de una tabla.