

En el Foro de XlineSoft y correos que he recibido, hay usuarios que desean que en la página LIST se pueda facilitar un gráfico en cada línea.
He tomado este ejemplo para explicar cómo se puede hacer con el Plugin de AnyChart.
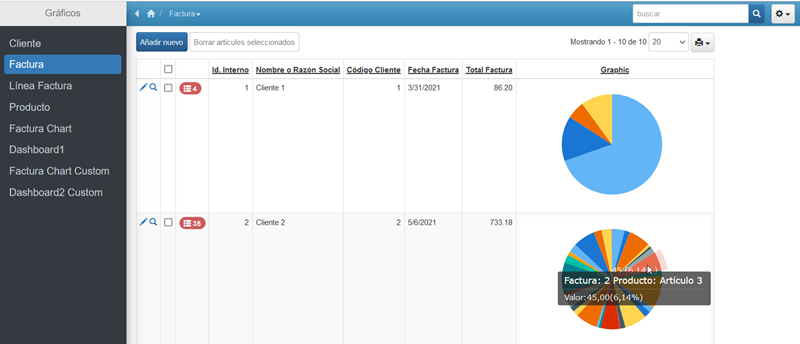
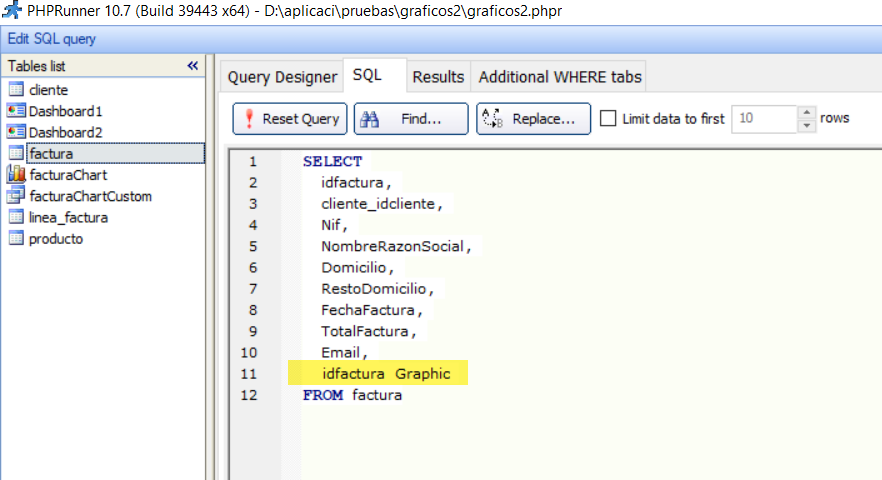
Ese campo nuevo de la tabla «Factura» es un duplicado del «idfactura» y lo utilizaremos con el plugin para crear el gráficos.
Y el código escrito para producir el gráfico está en el fichero (anychart_3.php):
<?php
/*
Variables passed by the Plugin:

$field_value .- Field what show screen
$DataValue  .- Valor del campo que se utiliza en el plugin
$javascript  .- File of Javascript of Anychart
$theme .- File of Theme of Anychart
$language  .- File Javscript of language
$decimalsCount .-  Parameter
$zeroFillDecimals .-  Parameter
$decimalPoint .-  Parameter
$groupsSeparator .-  Parameter
$license .- License of ANYCHART  for PHPRunner
$id_field .-  Field occurrence identification number used to identify the "container".
*/

global $conn;

$chartData='';

$idfactura = $DataValue;

$strSQLExists = "SELECT
factura.idfactura, factura.Nif, factura.NombreRazonSocial, factura.FechaFactura, factura.TotalFactura,
linea_factura.idlinea_factura, linea_factura.factura_idfactura, linea_factura.producto_idproducto, linea_factura.Nombre, linea_factura.Valor
FROM factura
left join linea_factura on (factura.idfactura = linea_factura.factura_idfactura)
WHERE idfactura = $idfactura ";

$rsExists = db_query($strSQLExists,$conn);

  while ($Row = db_fetch_array($rsExists)) {
    $idFactura='Factura: '.$Row["idfactura"].' Producto: '.$Row["Nombre"];
    $TotalValor=$Row["Valor"];
    $FechaFactura=$Row["FechaFactura"];
    $chartData.="['$idFactura', $TotalValor, $FechaFactura] \n,";
  }
$chartData = substr($chartData, 0, -1);

$graphicDefinition= <<<EOT

// create pie chart with passed data
var data = anychart.data.set([
// add data of the Client
 $chartData
    ]);

var wealth = data.mapAs({'x': 0, 'value': 1});

var chart = anychart.pie(wealth);

// License, out logo
$license

// apply coffee theme
// anychart.theme(anychart.themes.coffee);

// turn on chart animation
chart.animation(true);

// set chart title text settings
chart.title('Facturas del Cliente');
// Special
chart.title().enabled(false);


// Tooltip
var tooltip = chart.tooltip();
tooltip.titleFormat("{%x}");

tooltip.format("Valor:{%value}{groupsSeparator:.,decimalPoint:\\\\,,decimalsCount:2}({%yPercentOfTotal}{decimalPoint:\\\\,,decimalsCount:2}%)");

// URL Format in:  https://docs.anychart.com/Common_Settings/Text_Formatters

chart.labels().format('{%Value}{decimalsCount:0} ({%yPercentOfTotal}{decimalsCount:2}%)');

// set legend title text settings
var legend = chart.legend();
// set legend position and items layout
legend.position("center");
legend.align("Bottom");
legend.fontSize(10);
legend.itemsLayout("vertical");

// Special
legend.enabled(false);

// set container id for the chart
chart.container('container_$id_field');
// initiate chart drawing
chart.draw();
});
</script>
EOT;

$field_value .= $graphicDefinition;
?>
La nueva versión está programada en PHPRunner 10.7
Si te interesa este artículo, sigue leyéndolo en este link.